▪ 워드클라우드(word cloud)는 문자형 데이터를 분석하는 대표적인 방법으로, 대상 데이터에서 단어(주로 명사)를 추출하고 단어들의 출현 빈도수를 계산하여 시각화 하는 기능
wordcloud(words,freq,scale=c(4,.5),min.freq=3,max.words=Inf,random.order=TRUE, random.color=FALSE,rot.per=.1,colors="black",ordered.colors=FALSE, use.r.layout=FALSE,fixed.asp=TRUE, ...) -
주요 옵션 설명
- words : 출력할 단어들
- freq : 언급된 빈도수
- scale : 글자크기
- min.freq : 최소언급횟수지정 - 이 값 이상 언급된 단어만 출력합니다.
- max.words : 최대언급횟수지정. 이 값 이상 언급되면 삭제됩니다.
- random.order : 출력되는 순서를 임의로 지정합니다
- random.color : 글자 색상을 임의로 지정합니다.
- rot.per : 단어배치를 90 도 각도로 출력합니다.
- colors : 출력될 단어들의 색상을 지정합니다.
- ordered.colors : 이 값을 true 로 지정할 경우 각 글자별로 색상을 순서대로 지정할 수 있습니다.
- use.r.layout : 이 값을 false 로 할 경우 R 에서 c++ 코드를 사용할 수 있습니다.
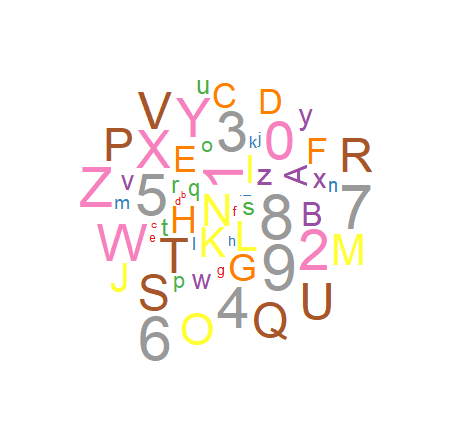
# wordcloud : 단어 구름
library(wordcloud)
wordcloud(c(letters,LETTERS,0:9),seq(1,1000,len=62))
# letters : 소문자 목록
# LETTERS : 대문자 목록
# 0:9 : 숫자 목록
# c(letters,LETTERS,0:9) : 소문자+대문자+숫자로 이루어진 벡터
# : 단어 구름에 표시되는 문자는 62가지
# seq(1,1000,len=62) : 빈도수
# seq(1,1000,len=62) : 1부터 1000까지의 숫자를 62개로 나누어 저장

# 색상을 사용해서 단어 구름을 생성하기
library(RColorBrewer) #wordcloud install시 함께 install됨
palete <- brewer.pal(9,"Set1") #파렛트
wordcloud(c(letters,LETTERS,0:9),seq(1,1000,len=62),colors=palete)
# KoNLP 패키지 설정
# 자연어 처리 패키지
install.packages("remotes")
# KoNLP 패키지 설치
remotes::install_github('haven-jeon/KoNLP',upgrade='never',INSTALL_opts=c("--no-multiarch"))
library(KoNLP)
library(wordcloud)
library(RColorBrewer)
# getwd() 폴더에 mis_document.txt 파일 읽어오기
# setwd("mis_document.txt 파일 존재하는 폴더")
text <- readLines("mis_document.txt",encoding="UTF-8")
text
# 사전 로딩
buildDictionary(ext_dic='woorimalsam') #우리 말씀 한글 사전 로드 #console 창에 엔터치기
pal <- brewer.pal(8,'Dark2') #팔레트 생성
# 명사 추출
noun <- sapply(text,extractNoun,USE.NAMES = F) #명사 추출
noun
# list -> 벡터 문자로 나눔
noun2 <- unlist(noun)
noun2
# 단어들의 빈도수 저장
wordcount <- table(noun2)
wordcount
# 빈도수가 높은 단어 10개만 추출. temp 변수에 저장
temp <- sort(wordcount,decreasing=T)[1:10]
temp
# 공백 제거
temp <- temp[-1]
temp
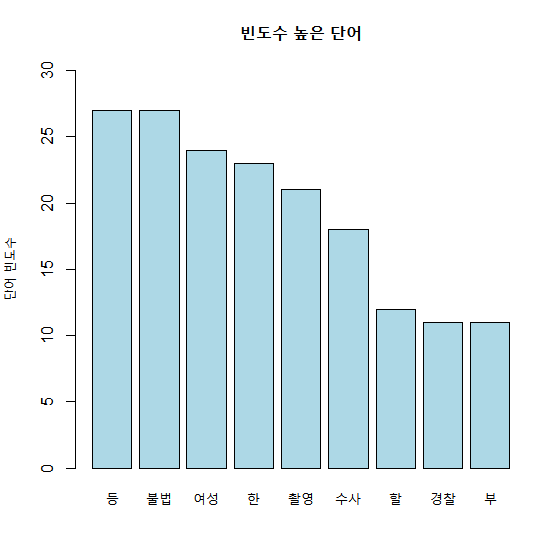
# 막대 그래프
barplot(temp,names.arg=names(temp),
col='lightblue',
main='빈도수 높은 단어',
ylab='단어 빈도수',
ylim=c(0,30))
# 워드 클라우드
wordcloud(names(temp),temp,scale=c(6,0.7),random.order = F,
rot.per = 1,
colors=pal)

# 워드 클라우드 2
temp <- sort(wordcount,decreasing=T)[1:30]
temp <- temp[-1]
wordcloud(names(temp), temp, scales=c(6,0.7),
random.order=T,
min.freq = 5,
rot.per=.1,
colors=pal)

함수 설명
# temp : 빈도수
# scale = c(6,0.7) 글자 사이즈 최대사이즈 6 ~ 최소사이즈 0.7
# min.freq = 5 : 빈도수가 5 이상인 단어들만 화면 출력
# random.order = F : (중앙부터)배치 부분을 무작위로 안하도록 = T : 무작위배치
# rot.per = .1 : 단어 표시시 새로 방향으로 표시할 단어의 비율
'R' 카테고리의 다른 글
| R - 인터랙티브 그래프 (0) | 2021.06.04 |
|---|---|
| R - 지도 시각화 (1) | 2021.06.03 |
| R - ggplot (0) | 2021.06.01 |
| R - 방사형 차트(radar chart) (0) | 2021.06.01 |
| R - treemap (나무지도) (0) | 2021.06.01 |


